Part 1: What is the business case for doing a Designed Experiment?
I got asked this question last week by an executive. What is the business case for this activity?
In a sentence it is all about efficiency and effectiveness of your experimental process. Are you interested in reducing development time and cost by 50% (or more). If so, then it is essential that your team learns to apply this technology. Unfortunately, there is not a pill you can give your team and just expect them to be skilled in the approach. It is a learning process. Scientists, engineers, and technicians need to get some training on the fundamentals and basics, read, and get their feet wet by doing applications on designs/processes they are working on. Do five experiments to understand what the techniques is all about, get 10 under your belt and you will be ready to do some things with this technique applied to your processes. Start out with simpler experiments, learn as you go.

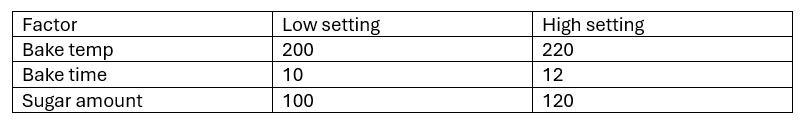
Let’s work with a hypothetical example. Suppose we are tasked with determining the best setting for factors in the creation of a chocolate chip cookie. The factors and levels the team decides to test are:
Additionally, suppose we have a panel of 5 taste testers, and they provide a consensus rating for each of the combinations tested (1 to 10 scale with lower numbers considered as less acceptable).
Using a traditional one-factor-at-a-time approach we decide to test the low setting of each factor as our baseline. Thus, the trial would be:
Bake temperature = 200, Bake time = 10, Sugar amount = 100; suppose for this trial the panel of taste testers provide a rating of 4.
Next, with this approach we would increase the Bake temperature to 220, while keeping the other two factors unchanged. For this combination we get a rating of 6. Better than the first combination so with this approach we would fix Bake temperature at 220.
Our third combination would be to keep bake temperature at 220, but now vary Bake time to 12 while holding the sugar amount constant at 100. For this combination our panel rates the taste as 7! Suggesting bake time of 12 is best.
Finally, we could conduct the last test with bake temperature help constant at 220, bake time at 12 and but increase sugar amount to 120. Suppose this combination is also rated as a six, suggesting we should use 100 as the amount of sugar.
In summary, the one-factor-at-a-time approach suggested the best settings are:
Bake temp =220
Bake time =12
Sugar amount = 100
With the resulting taste rating as a 7
What if we conducted a simple designed experiment using an orthogonal array matrix? For three factors at two levels there would be 8 unique combinations. Suppose we test these 8 trials and get the following:

Notice that combination 6 in the above table has a panel rating for taste of 9. Better than what we obtained from the conventional one-factor-at-a-time approach. The reason for this is there is an interaction between bake time and amount of sugar. One-factor-at-a-time experiments assume no interactions between factors relative to a response. Yet, with the world many of us are working in, technologies are highly interactive as well as non-linear.
Designed Experiments are the premier tool for characterization and modeling of complexity! Learn to use it to dramatically improve the efficiency and effectiveness of your experiments.
More details on Designed Experiments and one-factor-at-a-time.
One-factor-at-a-time as discussed can work if we are looking at scenarios where there is one response (which we want to maximize or minimize) and the interactions between factors are trivial. In my experience, teams frequently need to study multiple response types and they need to determine a target value for one or more of the responses. In these cases, one-factor-at-a-time breaks down. Hence the value of this approach is very limited.
In addition, with the above simple orthogonal array for the cookie problem we can also obtain some great graphical analysis which can readily add to our knowledge of the technology in question. With any designed experiment of this type, we can obtain five powerful graphs which we will now review.
The first graph is a main effects plot as displayed below:

The above graph suggests that both Bake temperature and amount of sugar have relatively large proportional effects on the taste of the cookies while bake time has a smaller impact (at least over the ranges we studied in the experiment). This of course is information that we cannot readily gleam from the one-factor-at-a-time approach.
Another graphic of great potential value is the interaction plot as shown below. In the plot parallel or near parallel lines suggest little or no interaction. As the line becomes more non-parallel, the interaction (or synergism between factors in question and the response) becomes more dramatic. As discussed, one-factor-at-a-time is unable to estimate or quantify the effects of interactions.

A third graphic of value…especially when you are attempting to target a response is the RSM plot as shown below:

It vividly displays the relationship between bake temp and amount of sugar from the values in the designed experiment and can help us visualize the relationship between variables.